828cloud

Data, Info and News of Life and Economy

Tag Archives: GDP

A Deep Dive into China’s Expectations-beating GDP Growth

From Caixin . . . . . . . . .

CHINA’S GDP grew 5.3 per cent year on year in the first quarter, surpassing market expectations of 4.9 per cent and the previous quarter’s 5.2 per cent, indicating the economic recovery was accelerating.

There was, however, the matter of a notable slowdown in the year-on-year growth figures for consumption, exports and industrial production in March as compared with the first two months of the year.

This was primarily due to contrasting base effects from 2023. The Omicron outbreak that struck after China scrapped most of its pandemic restrictions at the end of 2022 took a toll on the economy in the first two months of last year.

This created a low base that benefited this year’s growth figures for consumption, exports and industrial production for the January to February period. Conversely, the surge in demand that occurred after the outbreak subsided in March 2023 created a high base that hurt those same figures last month.

Still, China’s economic recovery has been patchy. This has been reflected in the macroeconomic data in the first quarter, with the following three aspects deserving attention: persistent low prices, stronger-than-expected infrastructure investment, and weak credit and social financing.

What’s keeping prices down?

China’s nominal GDP growth rate of 4.2 per cent in the first quarter was considerably below the real growth rate, mainly dragged down by weak prices.

The consumer price index remained unchanged year-on-year in the first quarter, while the producer price index fell 2.7 per cent. This was because supply outpaced demand, leading to higher output and lower prices.

On the demand side, services consumption and investment in infrastructure and high-end manufacturing were major drivers of economic recovery. However, goods consumption remained sluggish, and the protracted real estate slump weighed on the sector’s investment.

On the supply front, some industries faced temporary imbalances between supply and demand. Several emerging industries expanded rapidly, with capacity growing at a faster pace than market demand. This was exemplified by the price war in China’s new energy vehicle industry.

During the pandemic, overseas demand increased significantly, which helped absorb some domestic capacity. With demand from abroad now back to normal, domestic demand has yet to effectively fill the gap.

Why has infrastructure investment grown faster than expected?

The market had expected infrastructure investment would be low in the first quarter for two reasons.

The first was the fiscal constraints on local governments, with some localities classified as high-risk in terms of their debt burdens restricted from investing in infrastructure. Local governments across the board reported plunging land sales revenue as the real estate market remained sluggish.

The other reason was the first quarter saw slow progress in local government special-purpose bond issuance coupled with a decline in local government financing vehicles’ (LGFVs) net financing from bonds.

However, broad infrastructure investment grew 8.8 per cent year-on-year in the first quarter, up 0.6 points from the whole of last year, driven primarily by investments in power, railway and water conservation projects.

In January, the Ministry of Transport introduced the idea of adopting a proactive investment strategy for railway infrastructure this year. Investment in the railway transportation sector grew by 17.6 per cent year-on-year in the first three months.

Construction of water conservation projects, meanwhile, was a key target of the additional one trillion yuan (S$192 billion) in treasury bonds announced late last year. Investment in water management industries grew by 13.9 per cent year-on-year in the first quarter.

Those investments rely more on central government funds. In contrast, public facility management investments, which are mainly funded by local governments, fell 2.4 per cent year-on-year in the first quarter.

Why are credit and social financing weak?

People’s Bank of China figures show that the incremental amount of total social financing was down 1.6 trillion yuan year-on-year in the first quarter.

The slowdown in credit growth was a result of structural changes in financing entities. The services sector and emerging manufacturing industries are the backbone of China’s economic recovery at this stage. However, they have less financing demand and get less of their financing needs met than real estate companies, local governments and LGFVs.

While real estate developers are constrained by the market downturn, local governments and LGFVs face greater scrutiny from the central government, which is focused on resolving their debt issues.

Additionally, the slow issuance of local government special-purpose bonds also dragged on the overall social financing.


Source : The Business Times


Read also at Deccan Herald

https://www.deccanherald.com/opinion/making-sense-of-chinas-magical-53-growth-2983364 . . . . .

China’s First-quarter GDP Growth Beats Expectations at 5.3%

China’s GDP beat expectations and grew 5.3% year-on-year in the first quarter, buoyed by strong exports and manufacturing investment, but weak domestic demand and an ailing property market remained concerns.

The latest figure, published by the National Bureau of Statistics (NBS) on Tuesday, came in higher than the average estimate of 4.9% growth in a recent Caixin survey of economists, despite a high base in the same period last year. It also exceeded the 5.2% growth in the fourth quarter.


Source : Caixin


Read also at BNN Bloomberg

China Reports Surprisingly Strong Growth Driven by Industry . . . . .

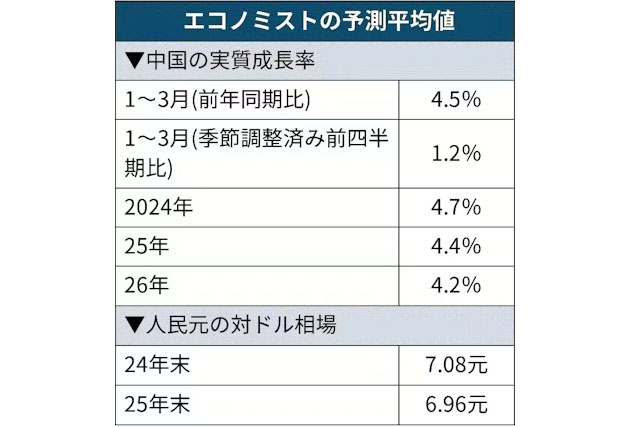
Charts: China Averge Forecasted Real GDP Growth Rate Was 4.7% in 2024 According to a Survey of Chinese Economists

Source : Nikkei

Chart: Ratio Between China and USA GDP Is Falling

Source : Caixin

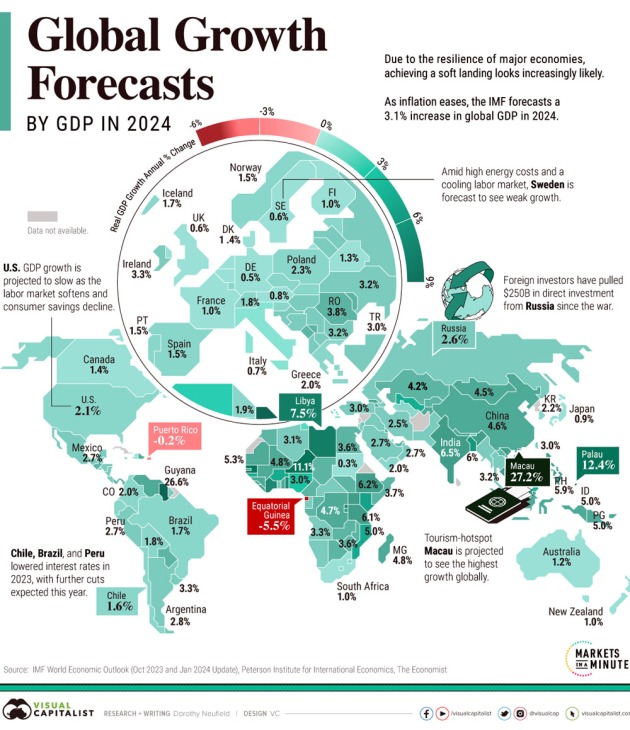
Mapped: GDP Growth Forecasts by Country in 2024

See large image . . . . . .

Source : Visual Capitalist

Chart: GDP Growth Among G7 Countries in 2023 and 2024 (Forecast)

Source : AXIOS

China’s Debt-to-GDP Ratio Climbs to Record 287.8% in 2023

China’s debt-to-GDP ratio climbed to a new record high in 2023 despite the slow pace of borrowing, reflecting the economy’s weakening growth, a new report from a state-backed think tank shows.

The macro leverage ratio, which measures total outstanding nonfinancial debt as a share of nominal GDP, rose to 287.8% in 2023, 13.5 percentage points higher than a year ago, according to a report by the National Institution for Finance and Development (NIFD).


Source : Caixin

Chart: Which Countries Have the Highest GDP Growth Rate?

Source : Statista

Overcoming Chinese GDP Myths

Antonio Graceffo wrote . . . . . . . . .

In March, at the National People’s Congress, Beijing set its annual gross domestic product (GDP) growth target. Since 1985, in every year but one, China has met or exceeded its official projections, raising doubts about whether or not Beijing’s claims of rapid growth can be believed. The New York Federal Reserve issued a report in 2020 that challenged the numbers, saying that China’s GDP growth chart was too smooth for the data to be authentic.

Typical of a communist system, the central government’s growth target is divided up and assigned as quotas for provincial governments, who in turn set quotas for local governments, and so on down the line. Politicians who fail to meet quotas can expect negative consequences so they are incentivized to lie, pumping up the numbers. The reports are inflated at each level until they no longer reflect reality by the time they reach the top. China’s National Bureau of Statistics knows this and uses a 5 percent deflator to adjust the reported numbers down. This single fact proves that China’s official GDP values are based on falsified data. Additionally, there is no evidence that the 5 percent reduction brings the numbers back to reality. Neither does it explain why China’s GDP growth hits the target year after year.

Last month, China’s former premier—the man who used to be in charge of the economy—Li Keqiang passed away. Having a PhD in economics, he knew the importance of free markets and wanted to liberalize the economy, prioritizing the private sector. However, he never managed to have a great impact or make historic changes to the economy because Xi Jinping seized control of the economy, taking all power from the premier. For foreign economists, though, Li’s greatest achievement is one that most people in China are unaware of, one that cannot be discussed or published in the country: the Li Keqiang Index.

According to WikiLeaks, Li stated, “GDP figures are ‘man-made’ and therefore unreliable.” Consequently, he used proxy data to attempt to quantify the economy. Li’s approach relied on three key indicators: electricity consumption, railway cargo volume, and bank lending. His rationale was that if electricity usage was up, then the factories must be working. The same is true of rail cargo if the trains are busy taking products to distributors and seaports. Finally, the volume of bank lending suggests how many new factories or expansions of existing businesses are being undertaken.

In 2014, the Chinese government claimed a 7.5 percent GDP growth, but Citibank economists had their doubts. The bank decided to apply the Li Keqiang Index with these specific weightings: railway freight traffic (25 percent), electricity consumption (40 percent), and medium—and long-term loans (35 percent). Sure enough, the index suggested that the GDP growth was much lower than Beijing’s claims. Citibank then looked at other proxies, such as commodity prices. China alone accounts for such a significant percentage of world demand for commodities that increased industrial and construction activity in China drives up world prices. However, in 2014, those prices were coming down.

The Li Keqiang Index is a good jumping-off point, but Western economists have added other elements of consideration, such as nighttime lights measured by satellites. Nighttime lights have been used, at least informally, in the past. It is common, when describing the difference in wealth between North and South Korea, to mention the fact that North Korea is nearly dark at night while South Korea is brilliant. Other data used are “retail sales, floor-space construction newly started, real estate investment, air passenger traffic, and exports.” This data can be corroborated with data from outside of China, such as real Chinese imports as reported by exporting countries.

A University of Chicago paper found that growth claims by autocracies were on average 35 percent larger than growth estimated by nighttime lights. For China specifically, the official data is believed to have been off by about a third. Four economists conducting a forensic investigation of Chinese GDP claims found that Beijing had falsified the data by an average of 1.7 percentage points per year. Using 2008 as a base year, they determined that, by 2018, the Chinese GDP had been overstated by a cumulative 20 percent.

For Beijing, this discrepancy is important because Xi Jinping has set a goal of exceeding the nominal GDP of the United States by 2049. That objective will now be delayed. For the common Chinese citizen, a smaller GDP means a smaller per capita GDP. The official per capita GDP is $12,556 per year, or more than $1,000 per month. Given the adjusted GDP numbers, China’s per capita GDP will not exceed that of the US until 2076.

The assumption that China’s per capita GDP is lower than Beijing’s claims seems very likely given the low salaries many Chinese receive. The country’s highest minimum wage is in Shanghai, where it is $370 per month. Other major cities and regions have minimum wages closer to $270 a month while the lowest is in Liaoning, where it is $195. According to official data, urban salaries are more than double rural salaries. An estimated 295 million rural dwellers have migrated from the countryside to the cities to take factory jobs. This represents nearly half of the country’s labor force.

The central government believes it controls the economy, but Li Keqiang proved that all they control is the reporting of the economy. The Chinese Communist Party can order falsified results, but they are powerless to change the underlying realities or force the numbers to add to a desired sum.


Source : Mises Institute

Infographic: U.S. GDP by Industry in 2023

See large image . . . . . .

Source : Visual Capitalist